
Deadline indicators
Each letter shows how many days it has left or how long it is overdue.
Interactive simulation
An official letter is logged, routed, handled, answered and filed in its case file. This simulator walks through that cycle with deadline status indicators and a records classification scheme.
| Case # | Subject | Department | Status | Deadline |
|---|---|---|---|---|
| OP-2026-0323 | Personal data access request (ARCO) | Transparency Unit | Received | 17 days |
| OP-2026-0322 | Results of the September 19 drill | Security and Civil Protection | Filed | Resolved |
| OP-2026-0321 | Onboarding of monitoring room staff | Human Resources | Received | Due in 1 d |
| OP-2026-0320 | Review of the security vendor agreement | Legal Department | Routed | 4 days |
| OP-2026-0319 | Submission of the internal civil protection program | Security and Civil Protection | Answered | Resolved |
| OP-2026-0318 | Information request about campus cameras | Transparency Unit | In progress | Overdue 3 d |
OP-2026-0321
Onboarding of monitoring room staff
Each letter shows how many days it has left or how long it is overdue.
Who received, routed, handled and filed it, with dates.
Fonds, sections and series with their case files, stage and retention periods.
Correspondence by status and department without building spreadsheets.
Simulation with fictitious data that runs entirely in your browser. The real system is configured with each institution's catalogs, roles and integrations.
More simulations
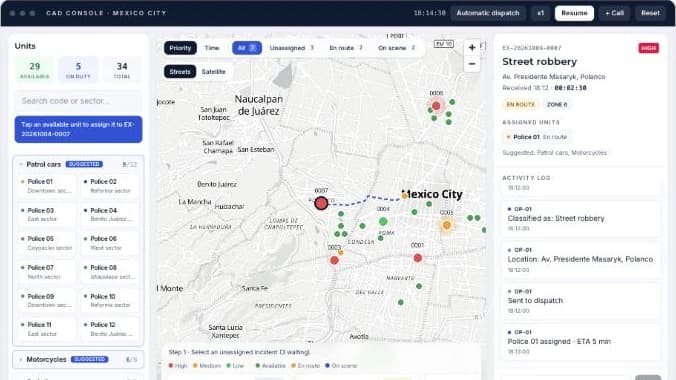
Take incoming incidents, dispatch units on the map and track response times in real time.
Open simulation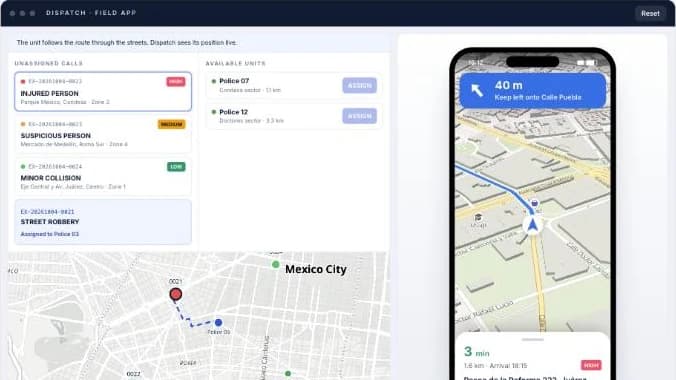
You assign the call from dispatch and the unit's phone receives it with turn-by-turn navigation to the scene.
Open simulation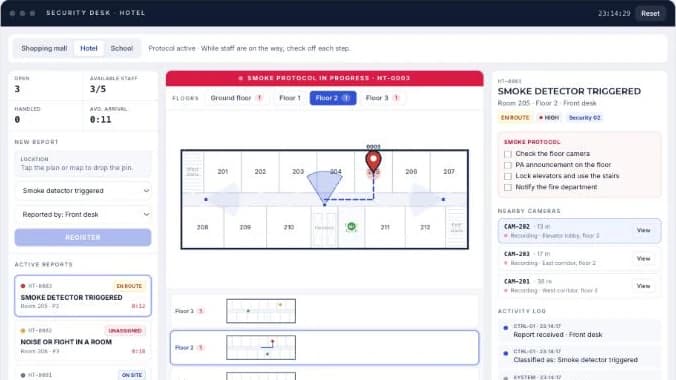
Drop the incident pin on the map or on each floor plan, assign the nearest staff member and follow the protocol.
Open simulation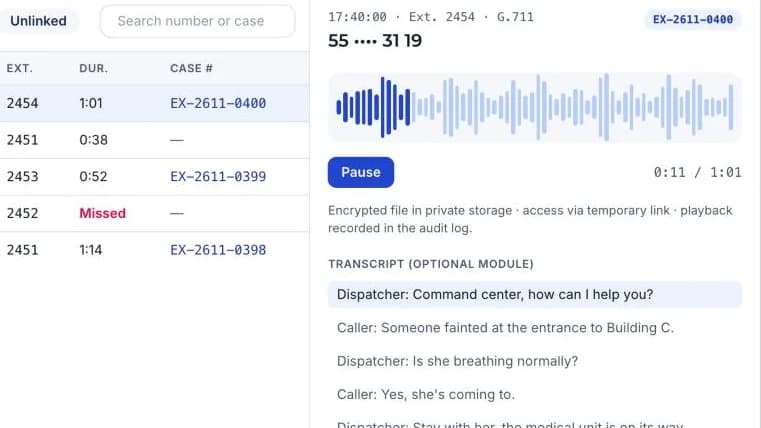
Live extensions, recorded calls, a filterable call log and a player linked to each case number.
Open simulation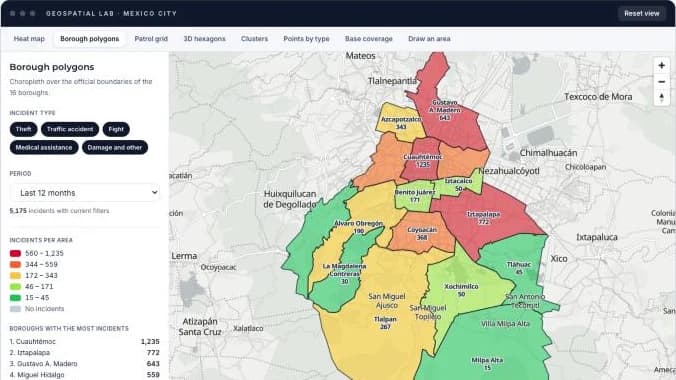
A heat map by hour of day plus seven more ways to read the same incidents: borough polygons, patrol sectors, 3D hexagons, clusters, base coverage and areas you draw yourself.
Open simulation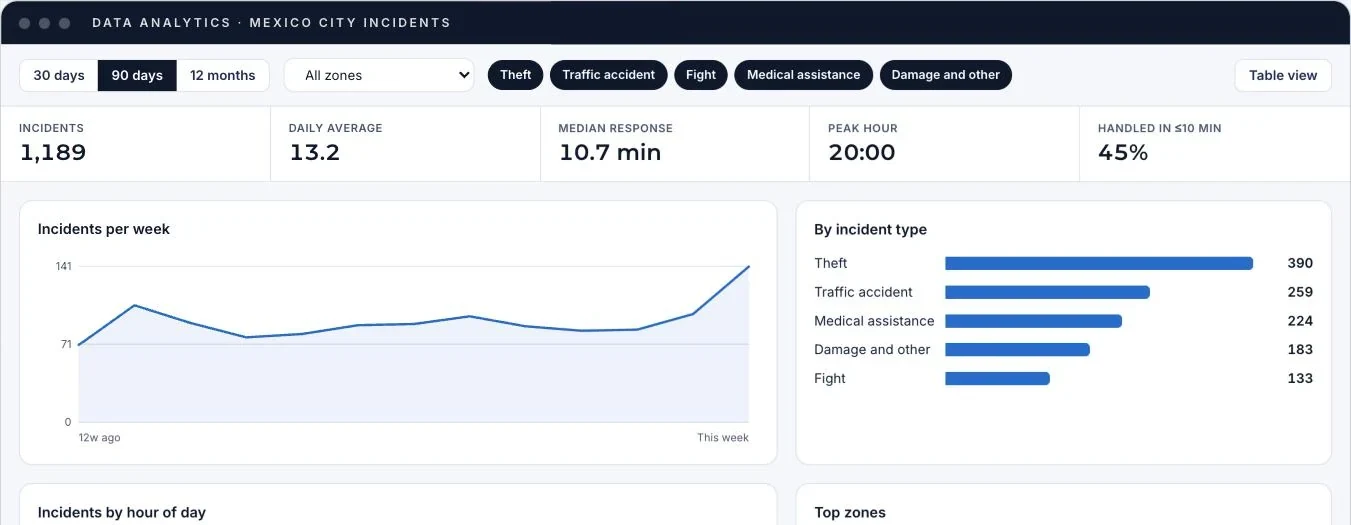
A dashboard with trends, incident types, peak hours, areas and response times, with filters and a table view.
Open simulationWe set up a demo with the catalogs and real cases from your operations.